
This post is almost entirely equal to my previous post: Modelling Under-reported Spatio-temporal Events. However, following the suggestions of several referees, the emphasis is only on crime events. The main point of the paper now focusses on the introduction of learning algorithms that estimate what in this literature is called the dark figure of crime. That is, the difference between reported crime and actual crime. Therefore, we have done our best to compare our paper to the relevant literature and to stress our contribution. Other than that, the results and post are the same and, after ten months, the paper is finally out (open access):
Riascos Villegas ÁJ, Ñungo JS, Gómez Tobón L, Dulce Rubio M, Gómez F. Modelling underreported spatio-temporal crime events. PLoS One. 2023 Jul 12;18(7):e0287776. doi: 10.1371/journal.pone.0287776. PMID: 37437032; PMCID: PMC10337961.
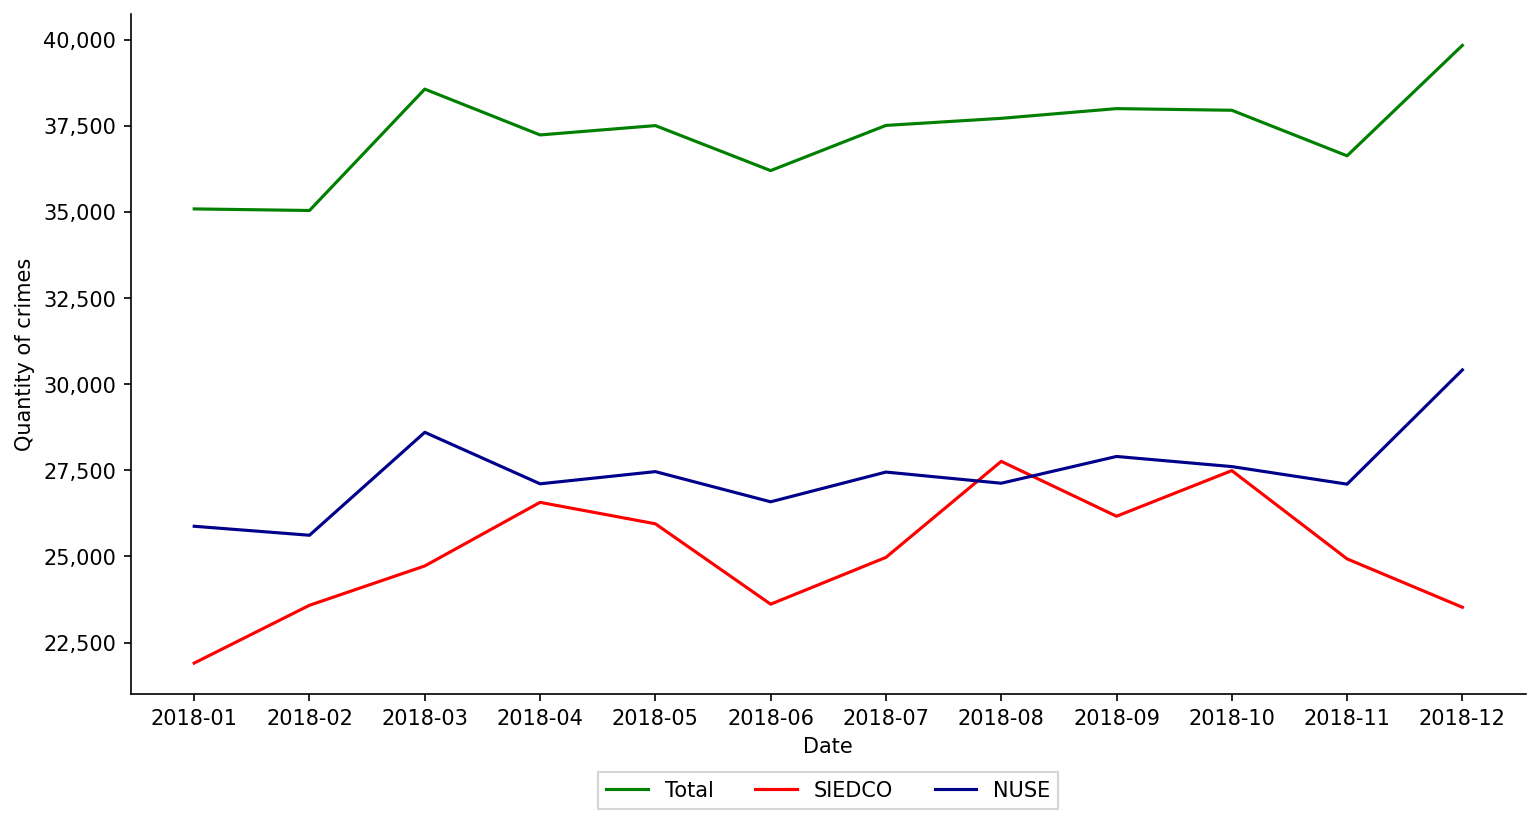
Before getting into the previous post, let me highlight the main result of the paper. While reported crime (blue line in the figure below) in the city of Bogotá can be substantial, arround 25,000 events per year, actual crime can be 40% higher, or 35,000 per year (green line in the same figure). However, the main point fo the paper is not to stress that this is in fact the case, but it is a methodological one. That is, we argue that this measurement is plausible and, most importantly, our methodology based on a modification of well known combinatorial multiarmed bandit algorithms, actually discovers this dicrepancy (i.e., the dark figure of crime). More details below:
In joint work with Jose Sebastian Ñungo, Lucas Gomez and Mateo Dulce (and now Francisco Gomez); we introduce an under-reporting model of spatio-temporal events motivated by relevant real-world applications such as citizen security. Under-reporting of socially sensitive events can undermine the credibility of official figures and can be used strategically by official agents or the general public. Models that simultaneously estimate incidence and under-reporting rates of events can be used to improve the allocation of public resources.
The under-reporting of data is a common phenomenon in many data-related problems. For instance, under-reporting is a widely studied problem in survey sampling, where it is an important example of non-sampling errors that can introduce biases in the estimations. This problem is of particular relevance in public policy issues where government agents try to monitor geographically distributed incidents that are often under-reported. For example, sanity restaurant food inspection services, child services, pest controls, building’s compliance safety regulations, animal poaching surveillance at natural parks, crime incidents in a city, among many others. For example in year 2021, the Bogota City chamber of commerce victimization and reporting survey reported an average victimization rate of 17% and, among those, only 49% said they had reported the event to the police.
To solve this model we modify well-known combinatorial multi-armed bandit algorithms. After validating our model, we use real crime data from a large city, Bogota – Colombia, showing that the model is able to estimate the true crime and under-reporting rates.
The next figure shows monthly aggregate violent crimes as reported in the offcial statistics of the City (red line SIEDCO). The blue line shows aggregate violent crimes as reported to the emergency and security call center of the City (blue line NUSE). The Total line is our estimate of crime. It is construted from SIEDCO and NUSE as explained in the article.
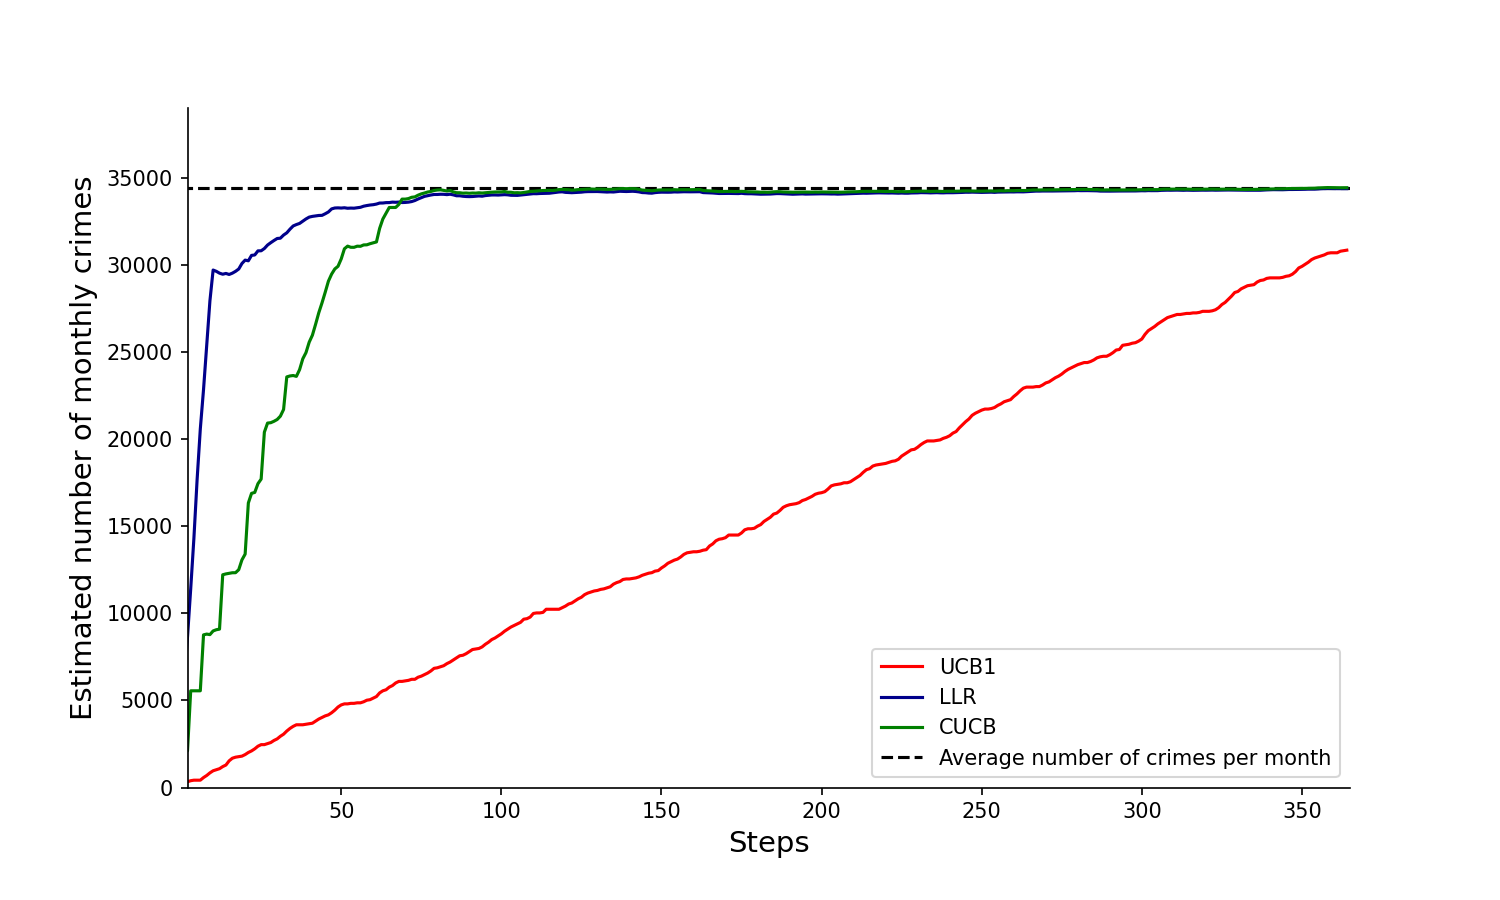
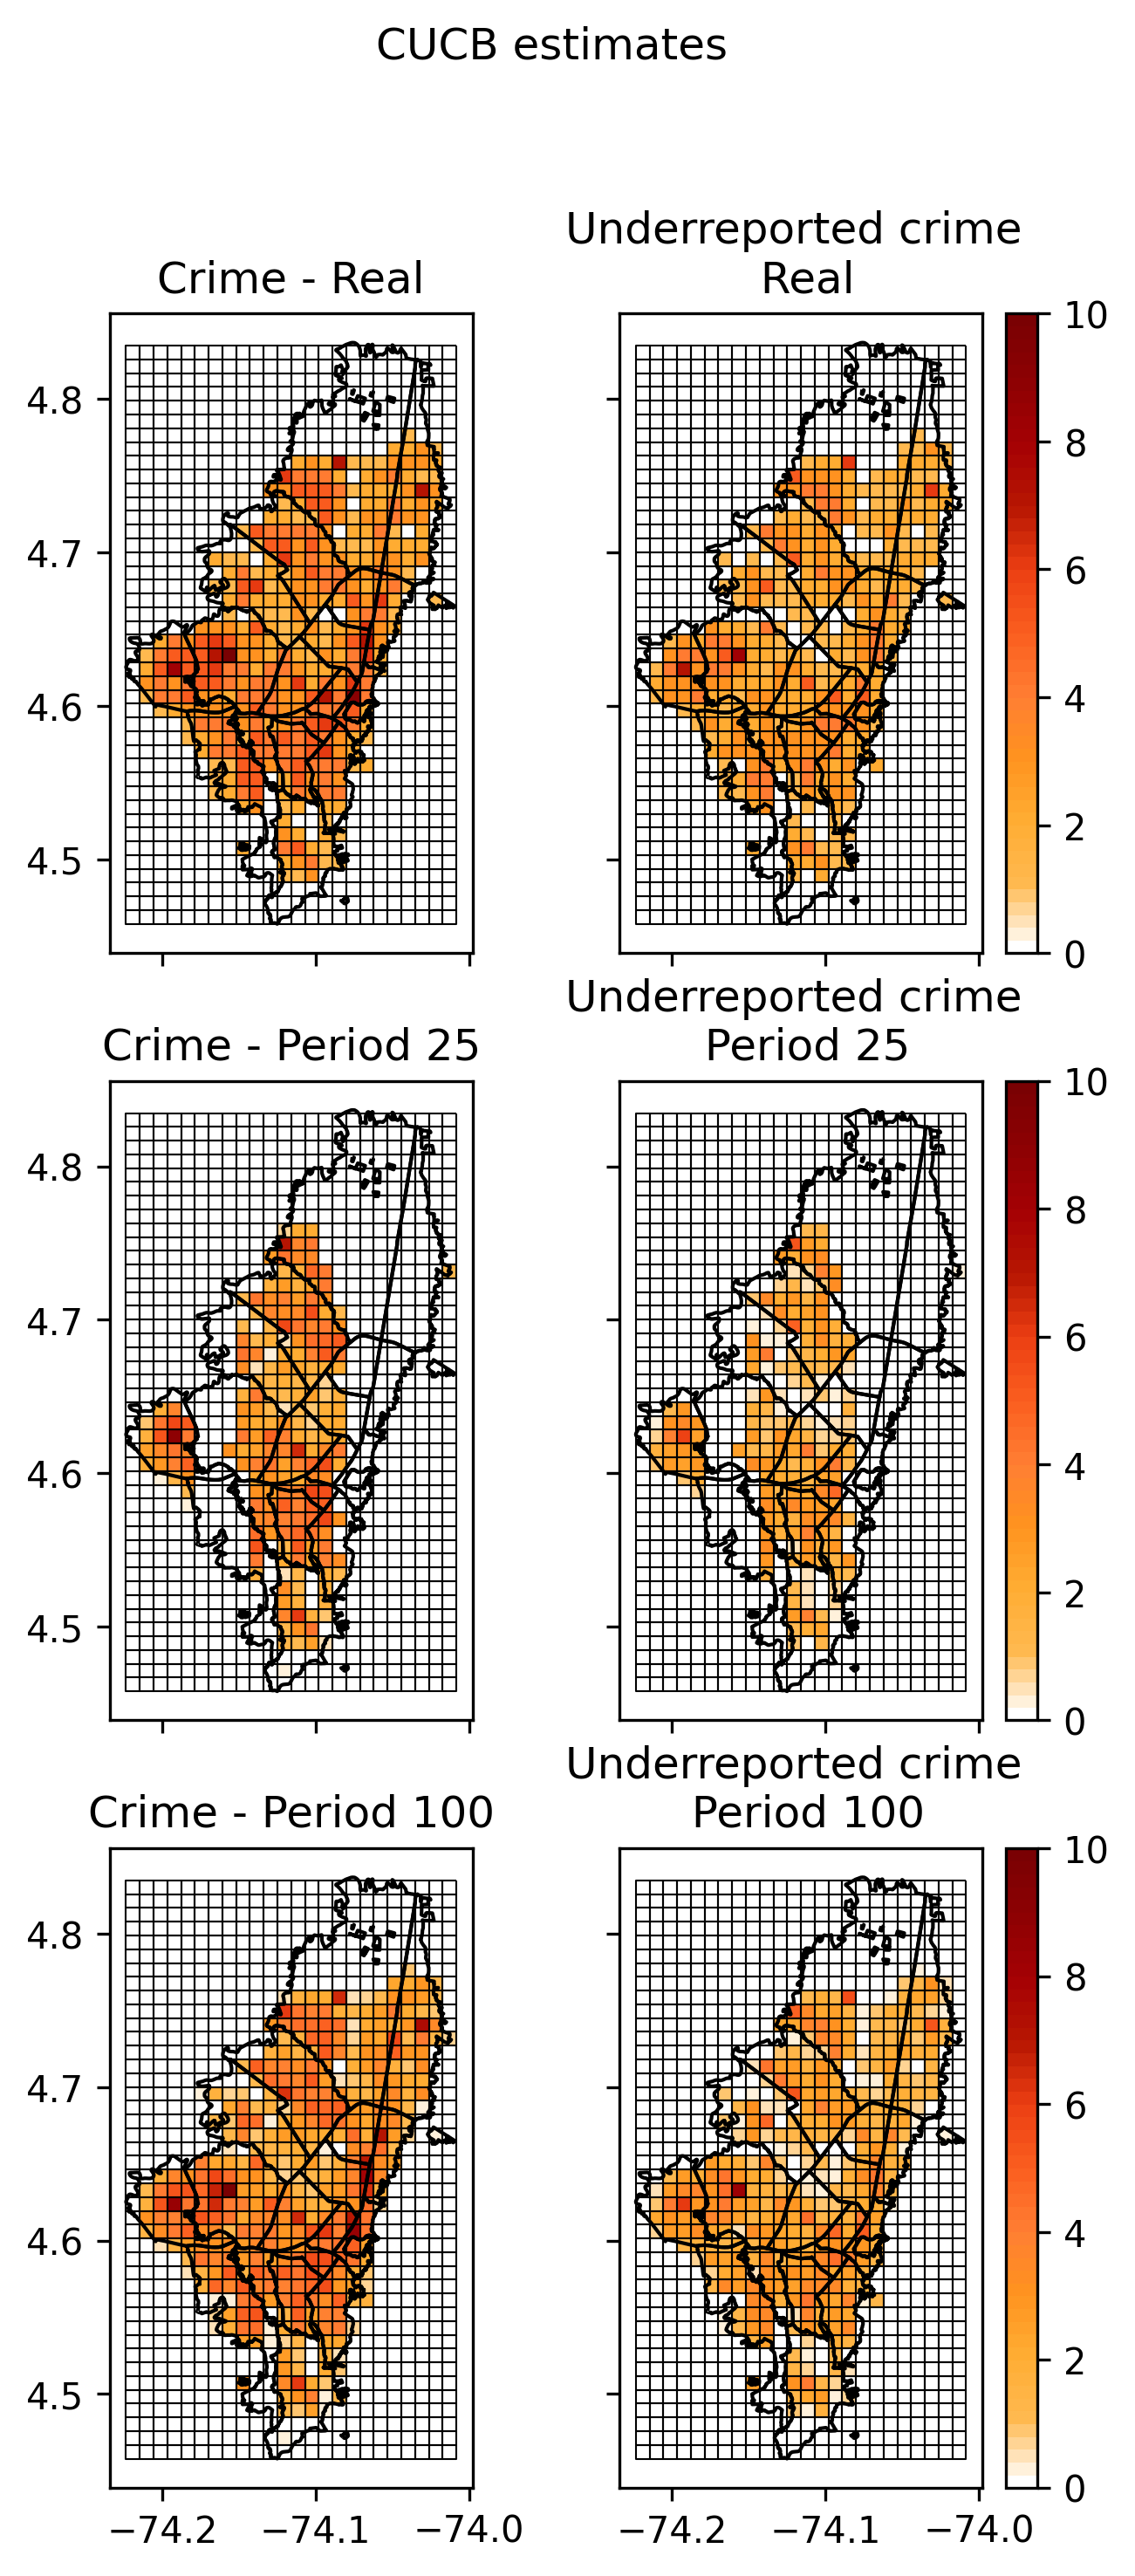
The next two pictures show how our proposed algorithm discovers the aggregate number of crimes in the city (first figure) and our estimated number of under-reporte crimes (second picture). Note that these two pictures try to discover, visiting in each period at most 10% of the area of the city, the true incidence and under-reporting rates, and they should be compared with our previos empirical estimate: Total and NUSE, of previous figure.
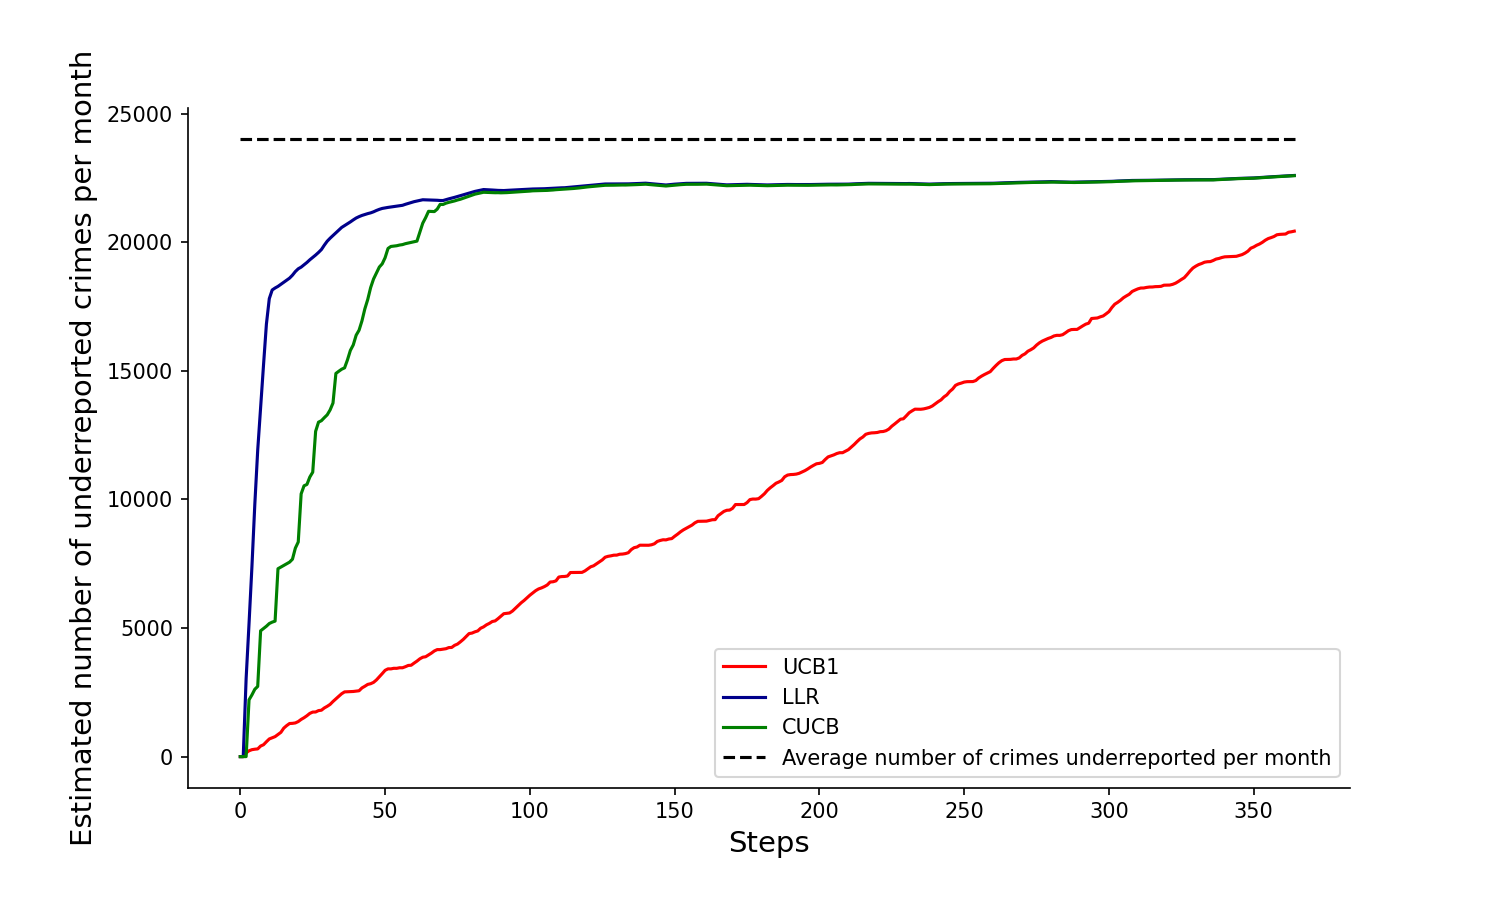
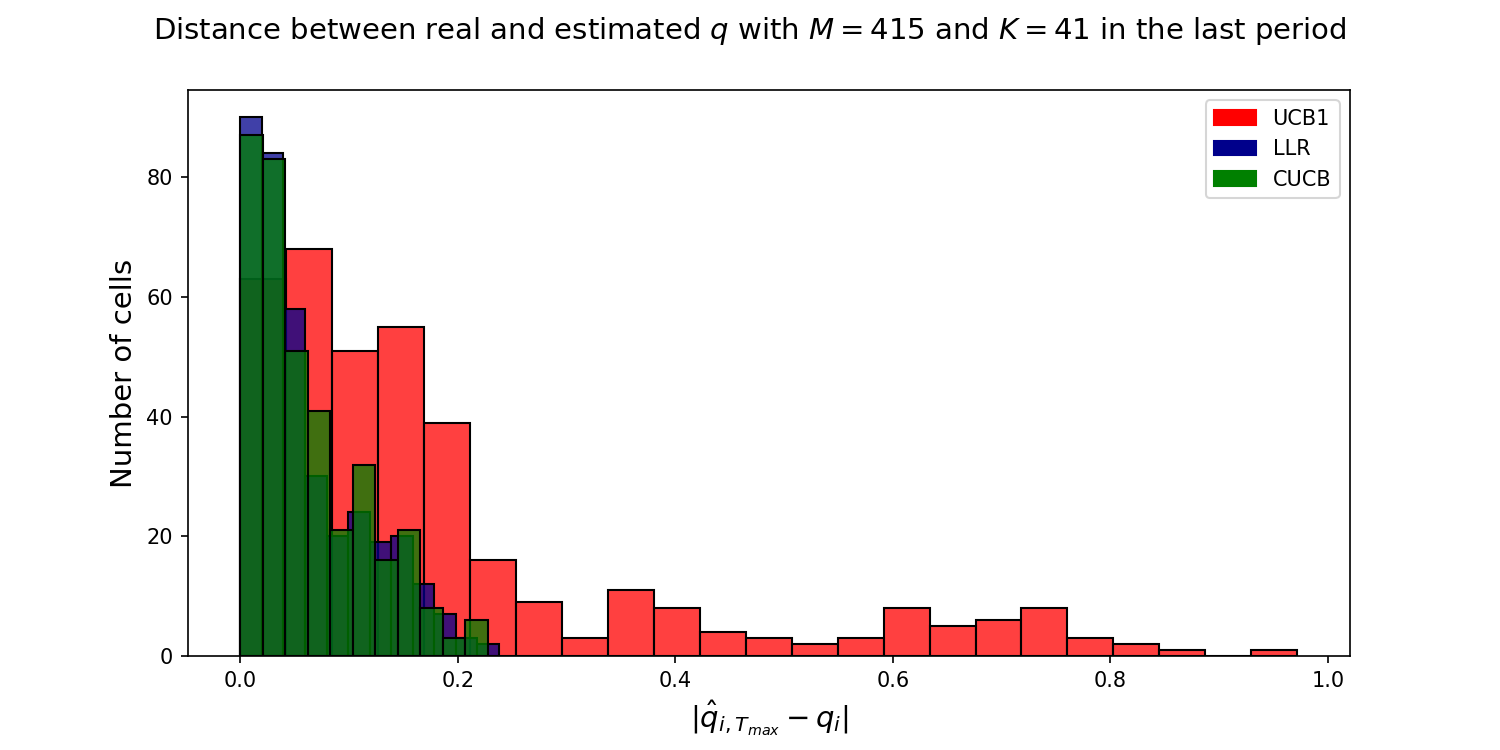
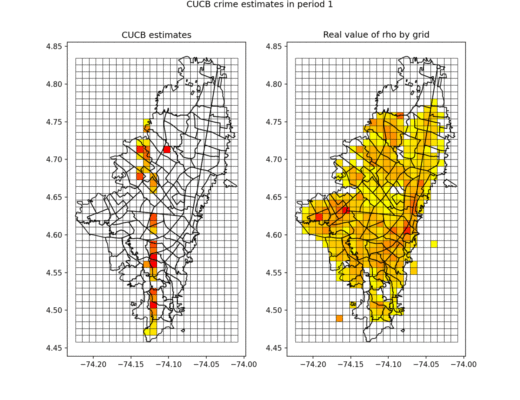
However, note from the previous figure, that none of the algortihms converge to the true under-reporting rate after 350 iterations. The next picture further explores the nature of this convergence. The figure shows an histogram of cells (i.e., 
Just for fun, the next figure ilustrates the convergence, using CUCB algorithm, of the estimated crime and under-reporting of events in the city, to the real values. The first column, second and third rows shows the heat map of the estimated crime incidence rates after 25 iterations and 100 iterations, respectively. The second column, first row shows real under-reporting as measured by NUSE dataset. The second column, second and third rows shows the heat map of the estimated under-reporting crime after 25 iterations and 100 iterations, respectively.
In a nutshell: the proposed model seems to work well for discovering the true incidence and under-reporting rates of special spatio-temporal events such as crime incidents.
A video of the presentation of this work in the Applied Mathematics Seminar of Quantil can be found at: Presentacion Seminario.
This was the presentation:
*Stable diffusion: “hidden figure of crime abstract”


1 Comment
ariascos@uniandes.edu.co
July 25, 2023 at 2:45 pmUn amigo me pidió el favor de explicar mejor y de forma muy sencilla, en que consiste el algoritmo del artículo. Decidí hacerlo aquí en los comentarios para que quienes ya leyeron el articulo solo vean las adiciones y/o aclaraciones.
Comencemos por describir algunos métodos para descubrir la verdadera incidencia del crimen en la ciudad. En todos los casos hacemos las siguientes dos hipótesis: (1) La fuerza policial y recursos son limitados y, por lo tanto, la policía no puede cubrir completamente la totalidad de la ciudad. (2) No conocemos perfectamente la verdadera incidencia del crimen en cada lugar de la ciudad (por ejemplo, en cada cuadrante, intersección de vía). Entonces, estas son algunas alternativas:
A) Se divide de en celdas la ciudad y en cada turno de policía se envían de forma aleatoria la fuerza policial a los diferentes puntos de la ciudad. Por hipótesis, la cantidad de policía no es suficiente para cubrir todas las celdas. En donde la policía hace presencia se descubre correctamente los incidentes de crimen (crimen descubierto). Donde no hace presencia solo se obtiene un subreporte del crimen (crimen reportado por terceros por ejemplo a través de la línea de emergencias de la ciudad NUSE ). Por supuesto, esto es muy ineficiente porque evidentemente después de un tiempo de asignar así la policía es claro que en algunos lugares se observa mucho más crimen que en otros y elegir de forma aleatoria entre estos no conlleva a que la policía visite más los lugares en los que hay más crimen. Así no opera ninguna policía del mundo.
B) Otra alternativa es mirar la frecuencia de crímenes que se han descubierto en el pasado y hacer algún tipo de modelo estadístico, de aprendizaje de máquinas, puntos calientes o cualquier modelo que permita identificar donde están los lugares con más incidentes. Entonces la policía puede asignarse con mayor probabilidad a estos puntos (i.e., calientes). Esta es una mejor alternativa, pero tiene el problema de que los datos descubiertos son principalmente de los lugares que visita la policía y a su vez la policía entrena su modelo con los datos que recopila y el modelo le dice que lugares debe visitar. El problema es que el modelo se comienza a segar hacia los lugares donde ya visito y potencialmente deja por fuera lugares en los que en ocasiones ocurre crimen, pero por azar cuando fueron visitado por la policía no hubo incidentes. Esta forma de explorar la ciudad no descubre la verdadera tasa de crimen en las diferentes celdas de la ciudad, sino que se va concentrando solo en algunos puntos sufriendo de lo que se conoce como sesgo de retroalimentación. Esta forma de desplegar la policía tampoco es la más común, pero variaciones de esta si son muy comunes.
C) Una forma de evitar el problema de sesgo de retroalimentación es usar un modelo, pero en ocasiones de forma aleatoria visitar lugares que no han sido sugeridos por el modelo. Esto es como una mezcla de las alternativas A y B y en ese sentido, toman lo mejor de ambas. Esta forma de hacerlo se conoce como explotar y explorar, no es muy eficiente para identificar la verdadera incidencia del crimen en la ciudad, pero tiene el mérito de: (1) A diferencia de la alternativa B, en efecto descubre la verdadera tasa del crimen y (2) A diferencia de la alternativa A, es más eficiente que la alternativa A. Variaciones de esta estrategia son usadas por todos los departamentos de policía del mundo.
D) Pero hay todavía una mejor forma de hacerlo. Esta forma es muy similar a la alternativa C pero en vez de visitar aleatoriamente algunas celdas que no han sido recomendadas por el modelo, se elige con mayor probabilidad de ser visitadas aquellas que, no han sido sugeridas por el modelo y se han visitado menos en el pasado. Esta alternativa captura lo mejor de las tres alternativas anteriores, es más eficiente y eventualmente descubre la verdadera incidencia del crimen en las diferentes celdas que se dividió la ciudad.
Por último, nuestro articulo modifica la alternativa D e introduce un modelo de subreporte de eventos de crimen de tal forma que en los lugares donde la policía no hace presencia se obtiene un subreporte de los eventos del crimen por ejemplo por llamadas a NUSE (que depende de la verdadera incidencia del crimen en el lugar) y con el cual la policía va generando una estimación del grado de subreporte en cada celda de la ciudad y que va actualizando con cada día que pasa.
La razón por la que funciona es que en la medida que los policías van descubriendo el crimen usando la estrategia D, también se va estimando el subreporte que, por hipótesis, es una función del verdadero crimen en cada celda. Como el algoritmo permite que se descubra la verdadera incidencia del crimen entonces, paulatinamente, se va descubriendo el verdadero subreporte.
¡Espero que ayude!