In joint work with Jose Sebastian Ñungo, Lucas Gomez and Mateo Dulce; we introduce an under-reporting model of spatio-temporal events motivated by relevant real-world applications such as citizen security. Under-reporting of socially sensitive events can undermine the credibility of official figures and can be used strategically by official agents or the general public. Models that simultaneously estimate incidence and under-reporting rates of events can be used to improve the allocation of public resources.
The under-reporting of data is a common phenomenon in many data-related problems. For instance, under-reporting is a widely studied problem in survey sampling, where it is an important example of non-sampling errors that can introduce biases in the estimations. This problem is of particular relevance in public policy issues where government agents try to monitor geographically distributed incidents that are often under-reported. For example, sanity restaurant food inspection services, child services, pest controls, building’s compliance safety regulations, animal poaching surveillance at natural parks, crime incidents in a city, among many others. For example in year 2021, the Bogota City chamber of commerce victimization and reporting survey reported an average victimization rate of 17% and, among those, only 49% said they had reported the event to the police.
To solve this model we modify well-known combinatorial multi-armed bandit algorithms. After validating our model, we use real crime data from a large city, Bogota – Colombia, showing that the model is able to estimate the true crime and under-reporting rates.
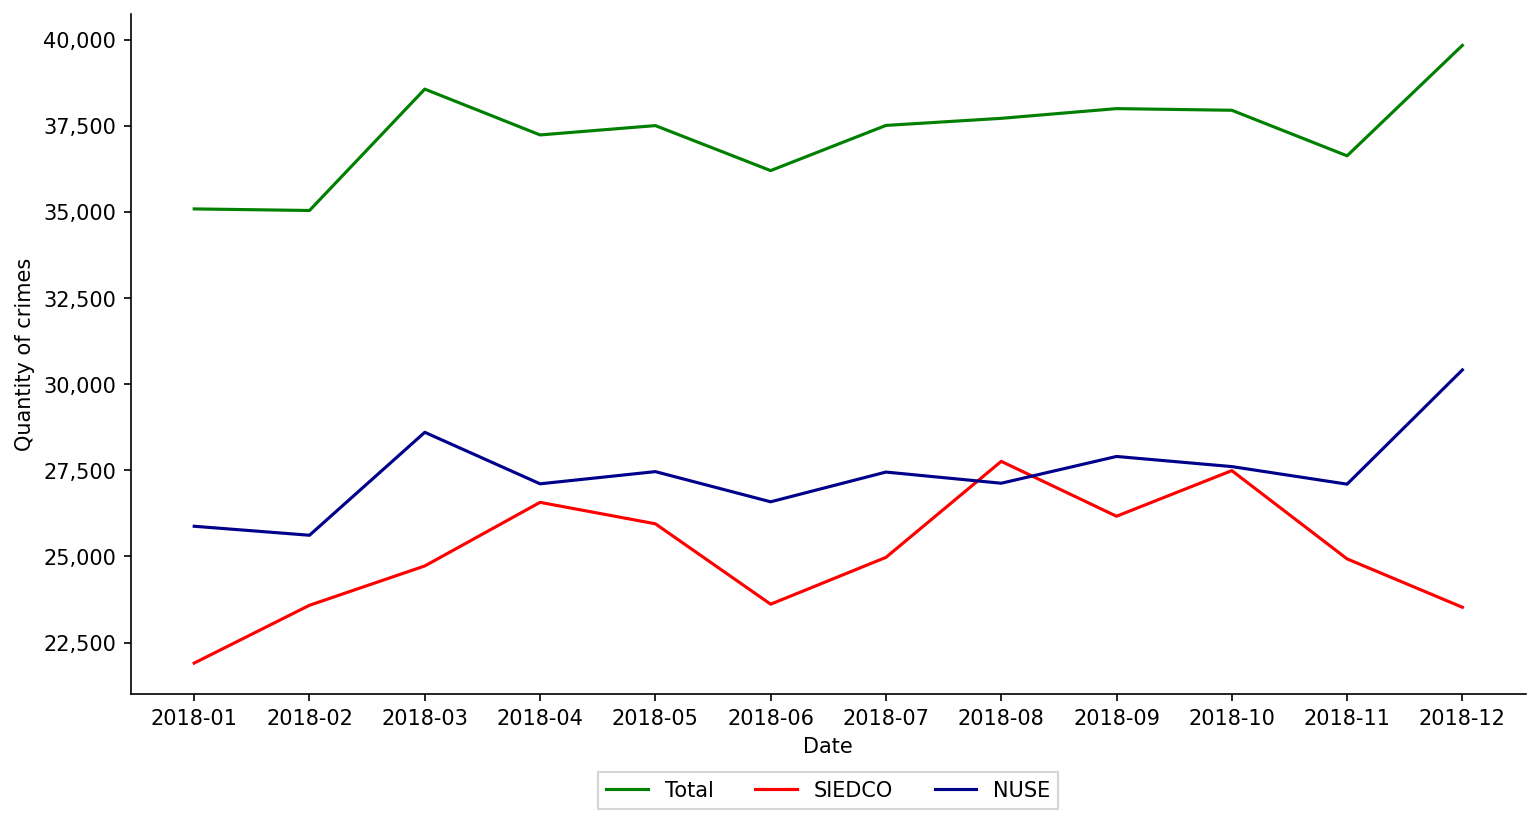
The next figure shows monthly aggregate violent crimes as reported in the offcial statistics of the City (red line SIEDCO). The blue line shows aggregate violent crimes as reported to the emergency and security call center of the City (blue line NUSE). The Total line is our estimate of crime. It is construted from SIEDCO and NUSE as explained in the article.
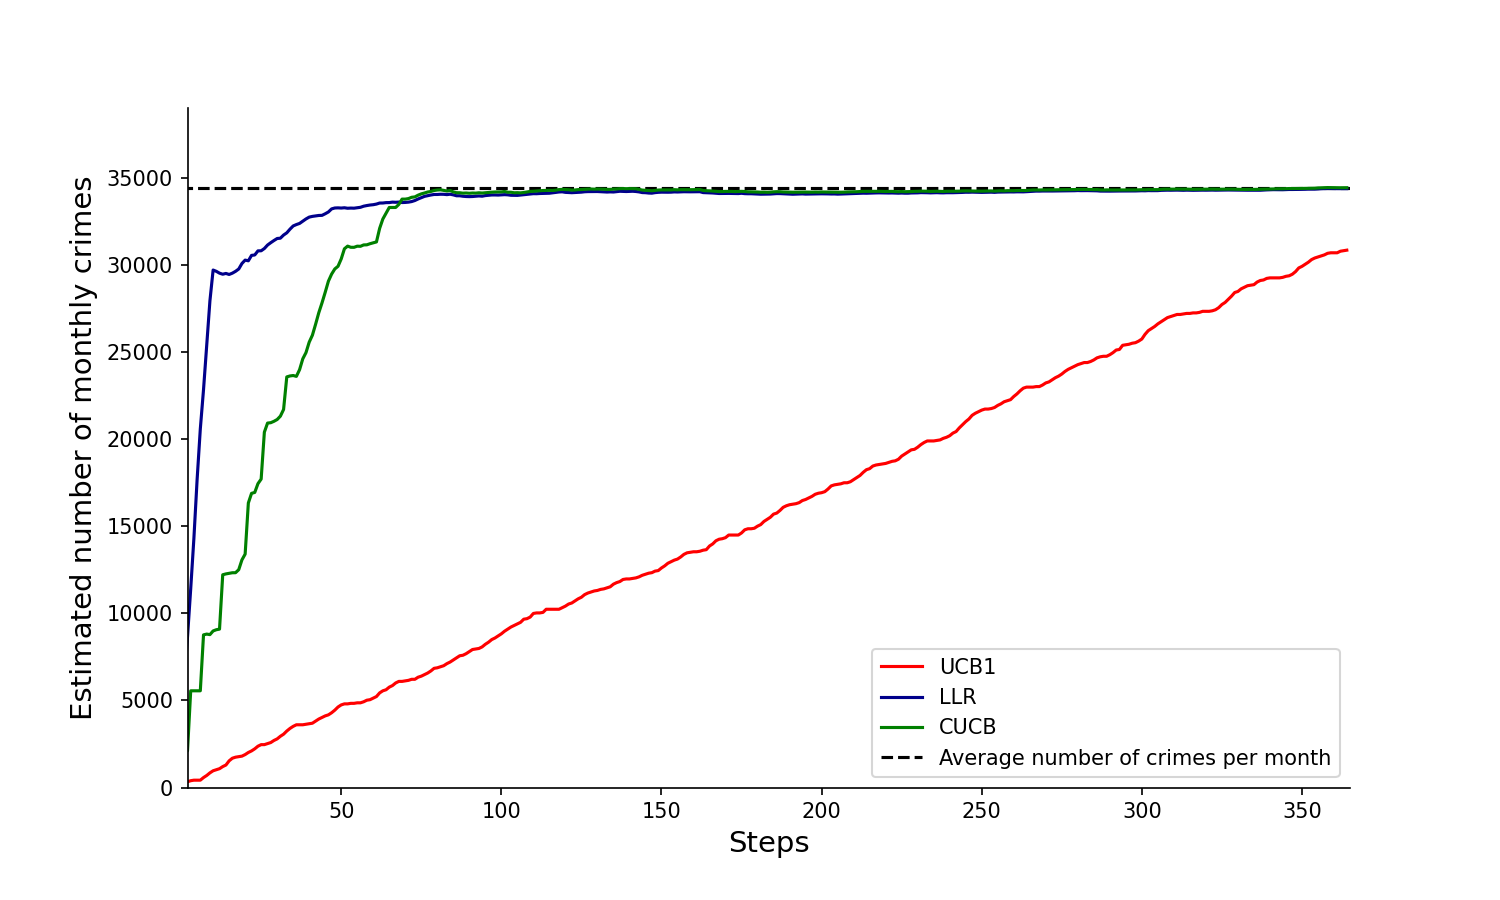
The next two pictures show how our proposed algorithm discovers the aggregate number of crimes in the city (first figure) and our estimated number of under-reporte crimes (second picture). Note that these two pictures try to discover, visiting in each period at most 10% of the area of the city, the true incidence and under-reporting rates, and they should be compared with our previos empirical estimate: Total and NUSE, of previous figure.
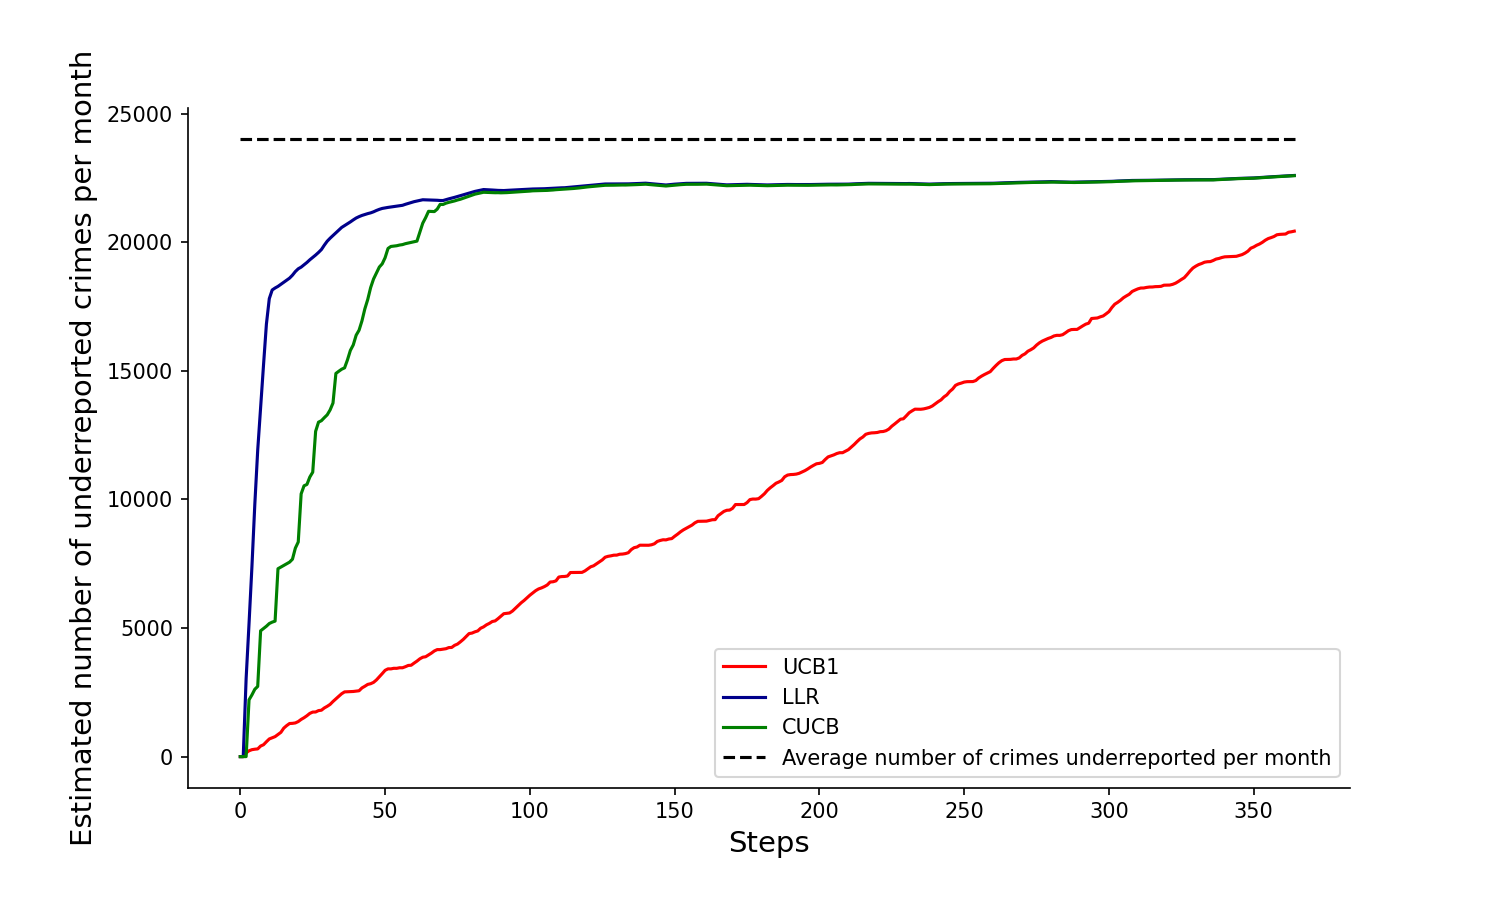
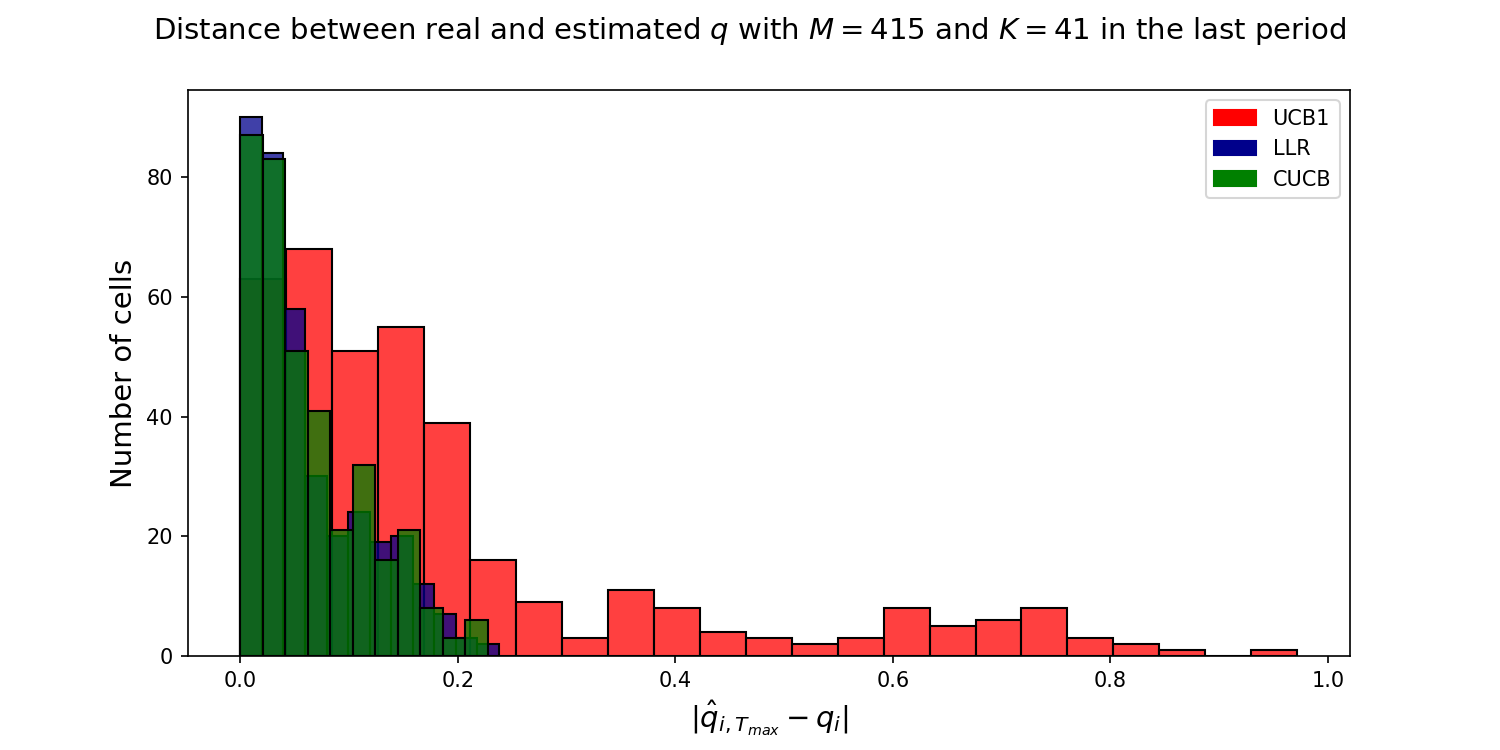
However, note from the previous figure, that none of the algortihms converge to the true under-reporting rate after 350 iterations. The next picture further explores the nature of this convergence. The figure shows an histogram of cells (i.e., 
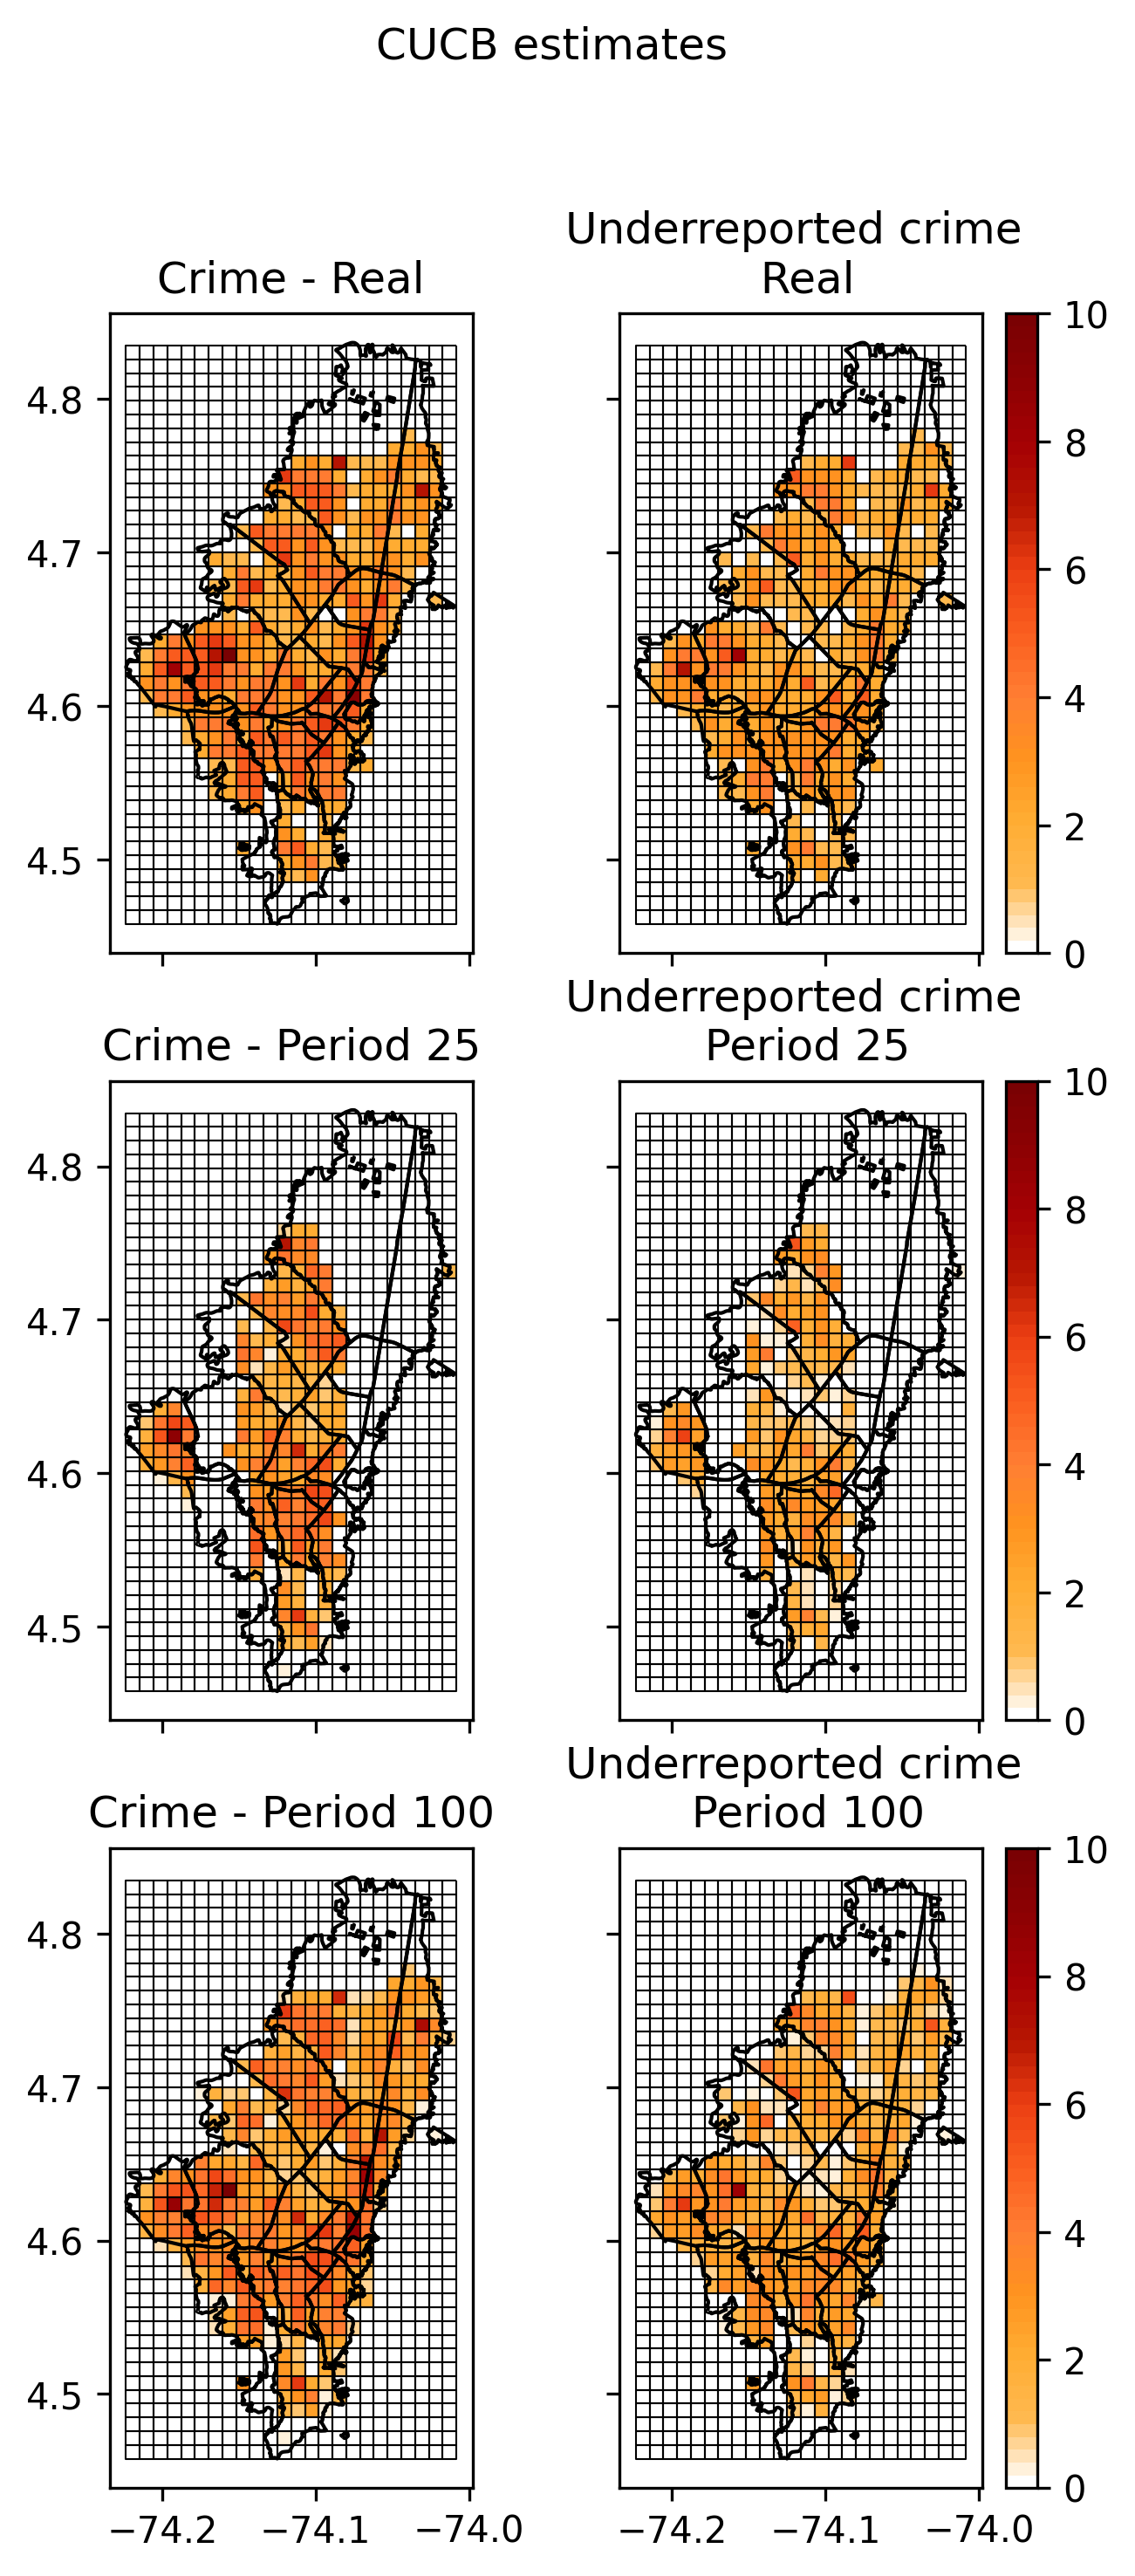
Just for fun, the next figure ilustrates the convergence, using CUCB algorithm, of the estimated crime and under-reporting of events in the city, to the real values. The first column, second and third rows shows the heat map of the estimated crime incidence rates after 25 iterations and 100 iterations, respectively. The second column, first row shows real under-reporting as measured by NUSE dataset. The second column, second and third rows shows the heat map of the estimated under-reporting crime after 25 iterations and 100 iterations, respectively.
In a nutshell: the proposed model seems to work well for discovering the true incidence and under-reporting rates of special spatio-temporal events such as crime incidents.
A video of the presentation of this work in the Applied Mathematics Seminar of Quantil can be found at: Presentacion Seminario.
This was the presentation:

No Comments